Economy of Mongolia

Mongolia’s extensive mineral deposits and growth in mining-sector activities have shifted Mongolia’s economy, which traditionally has been dependent on herding and agriculture. Mining, agriculture and service sectors are now the principle sectors in contributing to GDP. Growth has been spurred by the export of commodities such as gold, copper, and cashmere.

The economy is also highly dependent on trade with its neighbor’s. For example, Mongolia purchases 95% of its petroleum products and substantial amount of electric power from Russia, leaving it vulnerable to price increases. Trade with China represents more than half of Mongolia’s total external trade, with nearly 84 percent of Mongolia’s exports going to China.

Over the past decade, Mongolia has made important changes to its economic system, to become an open, dynamic market economy. Recent changes have also been introduced to its mining and investment legislation to generate stability for foreign investors.

GDP

According to the National Statistics Office (NSO), the GDP growth rate was 4.7%, comprising MNT 52.9 trillion. This is an increase of 21.4% (MNT 9.3 trillion) from the pre-pandemic level.

GPD growth rate (2018-2022,%):

Source: National Statistics Office

Mongolia’s largest contributor to GDP is mining (especially coal, copper, and gold), although its contribution can vary significantly based on global factors. Mongolia also has a significant agricultural sector, which consists primarily of traditional livestock farming and a growing services sector, including tourism and hospitality, transportation, and logistics, banking and finance, and telecommunications. Although Mongolia’s manufacturing sector is relatively small, it has gained traction as the government seeks to diversify the economy.

As per the Ministry of Economy and Development (MED), economic growth is predicted at 6% in 2023.

GPD by Sector (2022):


Source: National Statistics Office

Mongolia attained a real GDP growth of 4.8 percent in 2022. Among economic sectors,  the services, agriculture, and net taxes on products were the major contributors to the growth. Whereas the mining sector contributed negatively to the annual growth despite its production being boosted in the second half of the year. Owing to a recovery in household consumption and foreign trade, the net taxes increased by 11.5 percent, the trade sector by 8.0 percent, and other services by 4.9 percent, respectively. In addition, the agriculture sector’s growth reached 12.0 percent due to favorable weather conditions. According to the regular year-end counting, 25 million offspring matured making the number of livestock 71.1 million heads, the highest number on record. Moreover, the value-added of the manufacturing, electricity, and construction sectors increased by 6.1 percent compared to the previous year. This was mainly driven by the increase in the production of goods such as meat, beverages, and construction materials, as well as new residential constructions completed by domestic enterprises. Border restrictions eased in the second half of 2022 leading to a recovery in the mining sector’s production and exports. Exports of coal and crude oil increased by 3.6 times and 67 percent and reached 23.6 million tons and 2.5 million barrels respectively, compared to the second half of 2021. Despite this, the mining sector contracted by 11.9 percent annually.
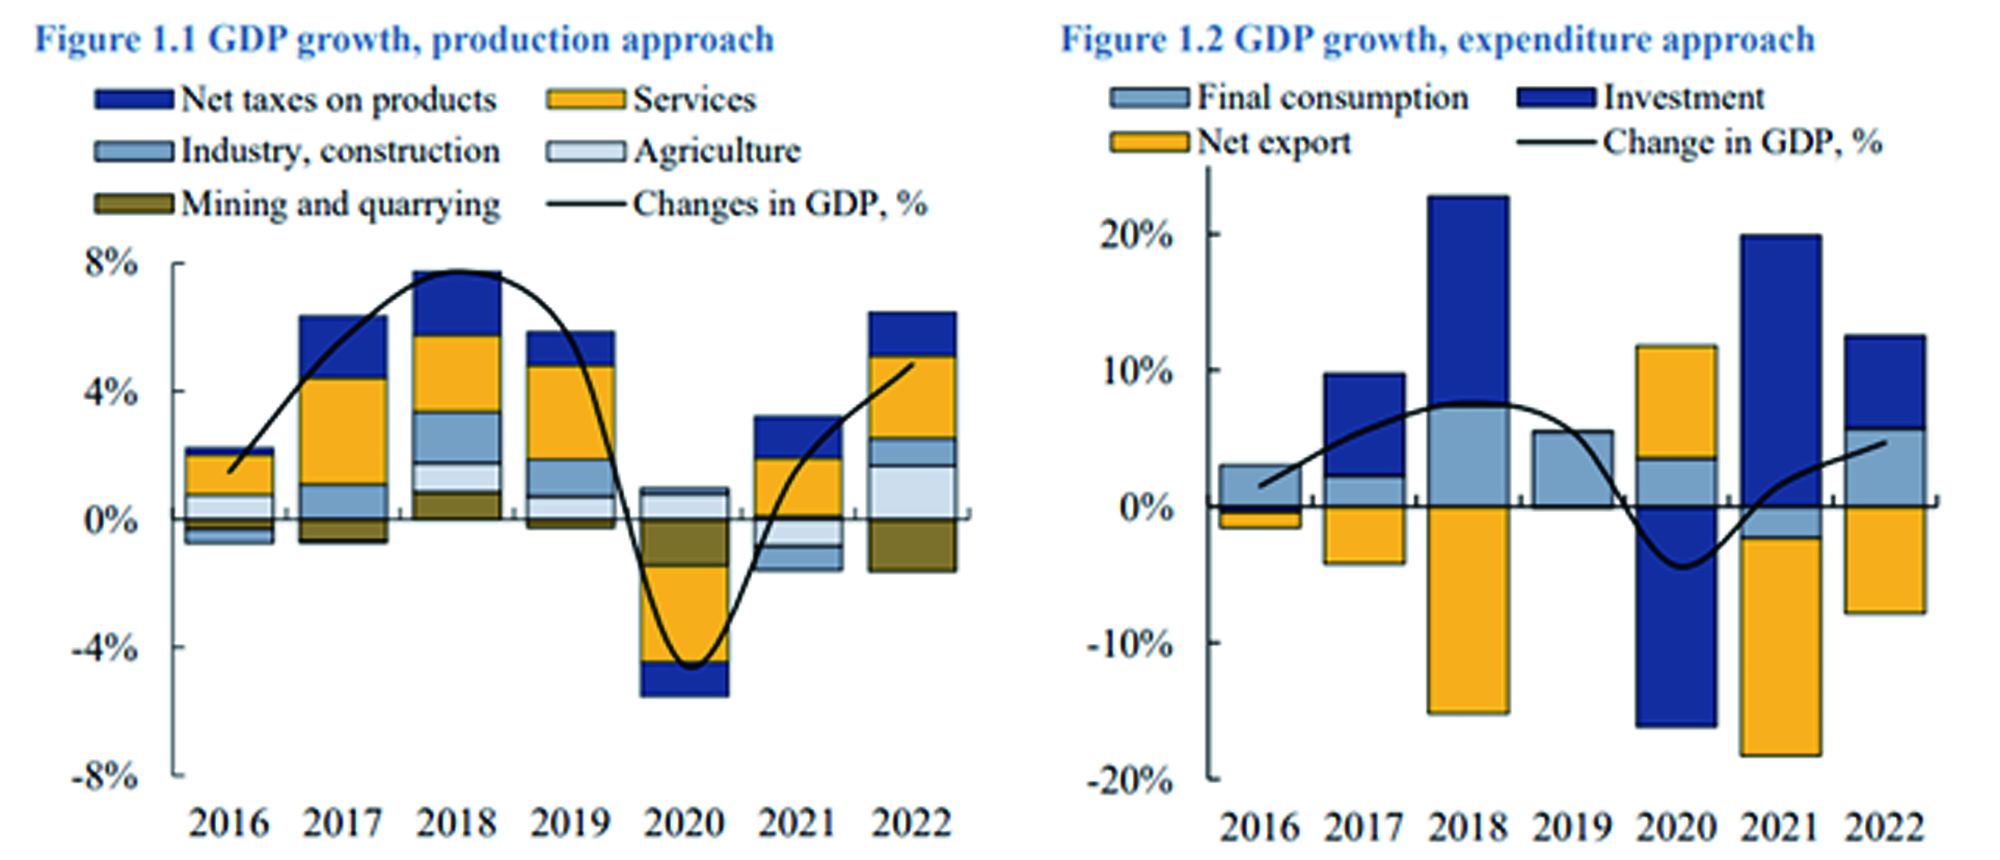
Source: Annual report 2022, Bank of Mongolia
External debt

In 2022, Mongolia’s outstanding external debt tentatively totaled 33,345 million USD, which is a decrease of 1 percent, or 461 million USD compared to the previous year. The change in external debt stock can be mainly explained by the following factors:

Government external debt decreased by 5 percent or 442 million USD, Central Bank’s external debt decreased by 17 percent or 431 million USD due to the repayment of the loan, as well as changes in the exchange rate.  Private sector external debt increased by 2 percent or 412 million USD due to the increase in commercial loans and trade and credit advance.

Mongolia’s Gross External Debt (Million USD)

Indicators

2020 2021 2022 Change Amt

(22’21)

%

Total external debt

32,362 33,806 33,345 -461 -1%

I. Government

8,654 8,454 8,012 -442

-5%

(Gov) GDP

65% 55% 48% -0.1

-14%

II. Central bank

2,221 2,610 2,179 -43.1

-17%

III. Deposit taking corporations

(Other than Central Bank)

1,651 1,627 1,533 -94.0

-5.78%

Short-term

594 361 224 -137

-38%

Long-term

1,057 1,265 1,308 43

3%

IV. Other sectors

8,430 8,843 8,436 -406

-5%

Short-term

683 812 1,622 810

100%

Long-term 7,747 8,030 6,814 -1217

-15%

V. Intercompany lending 11,406 12,272 13,185 913

7%

Source: Ministry of Finance, Bank of Mongolia

Inflation

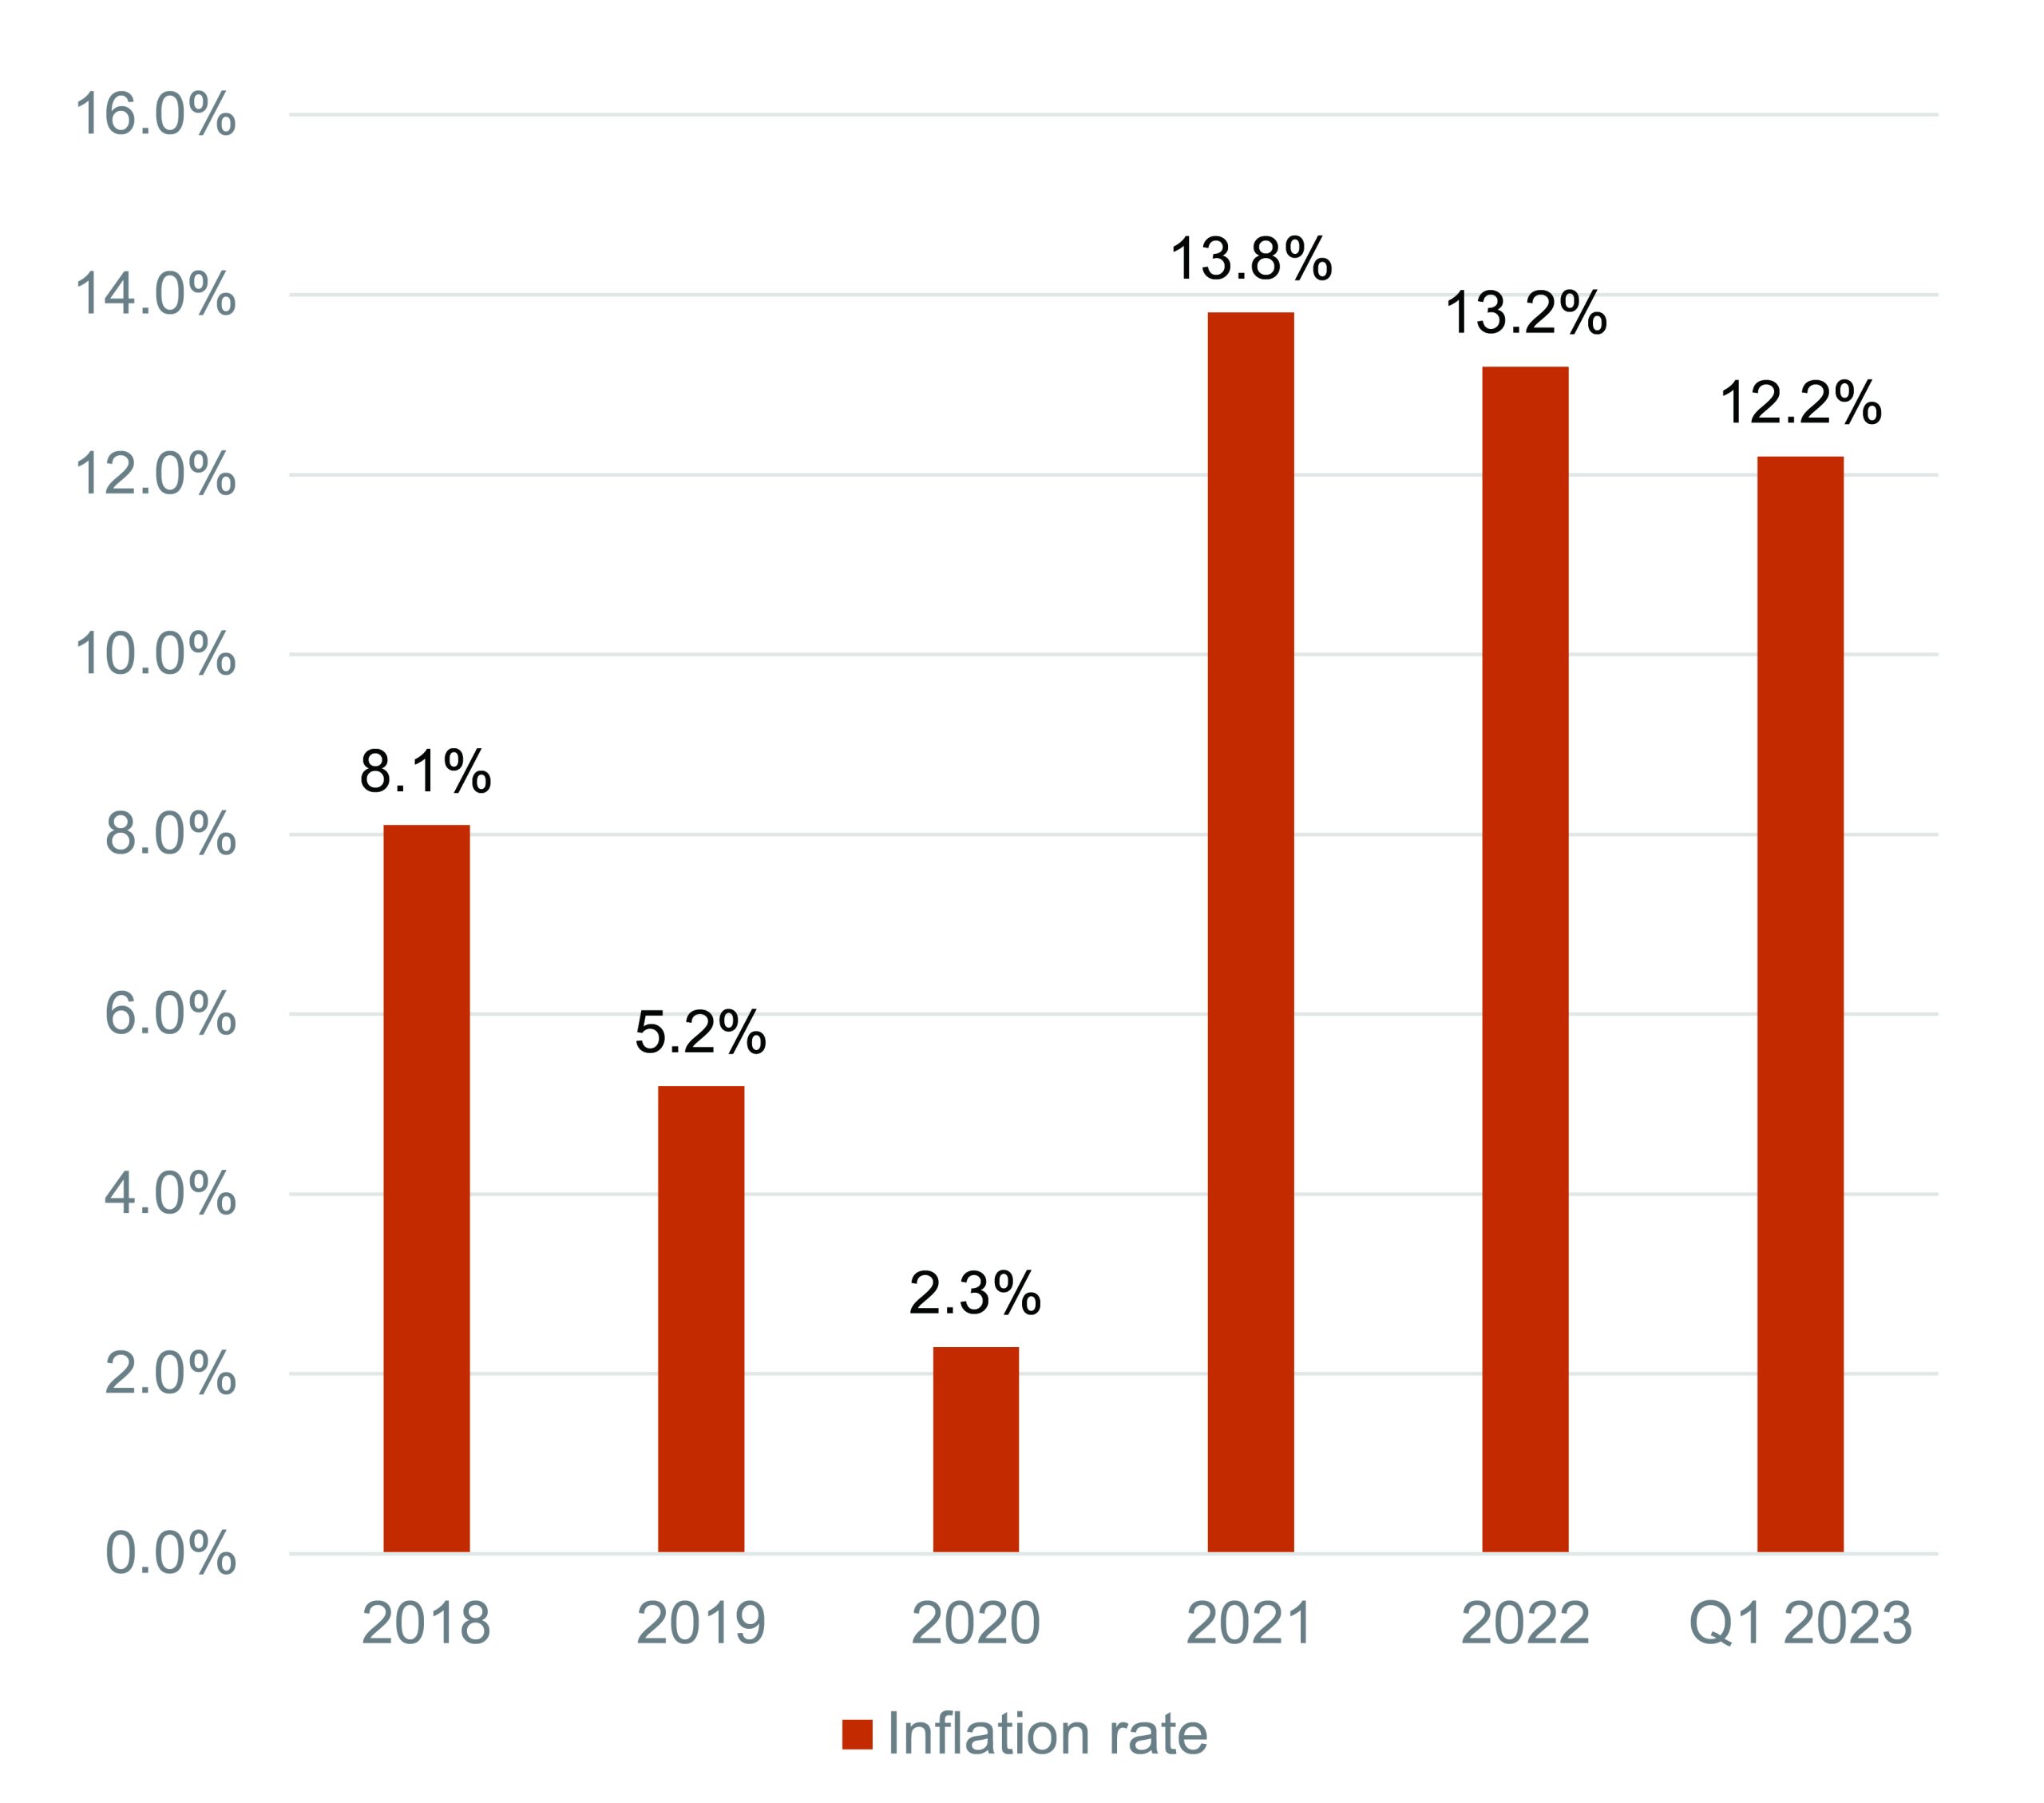
The inflation rate in Mongolia remains high. According to the NSO, the average inflation rate is 12.2% in the first quarter of 2023. The inflation peaked at 16.9 percent in June 2022 because of the pandemic and has since gradually decreased. Although it remains high compared to pre-pandemic levels, the inflation rate is falling as the foreign exchange market, and the prices of imported goods stabilize. The inflation rate forecast shows a drop-down to single-digit levels.

Price stability is a fundamental factor for the country’s sustainable economic growth. The monetary policy of the Central Bank of Mongolia relies on a regime of inflation targeting, to maintain price stability and to minimize fluctuations in economic growth.

Inflation (%, 2018 to Q1 2023)

Source: National Statistics Office

Foreign Direct Investments (FDI)

From 2021 to 2022, the total FDI inflow was 6.1 billion USD. As of the first quarter of 2023, the net inflow of FDI was 593.4 million USD which has increased by 6% compared to the same period of the previous year.

Total FDI inflow (USD million, 2018-2022)

Source: National Statistics Office

Main FDI by sector (Q3, 2022)


Source: National Statistics Office

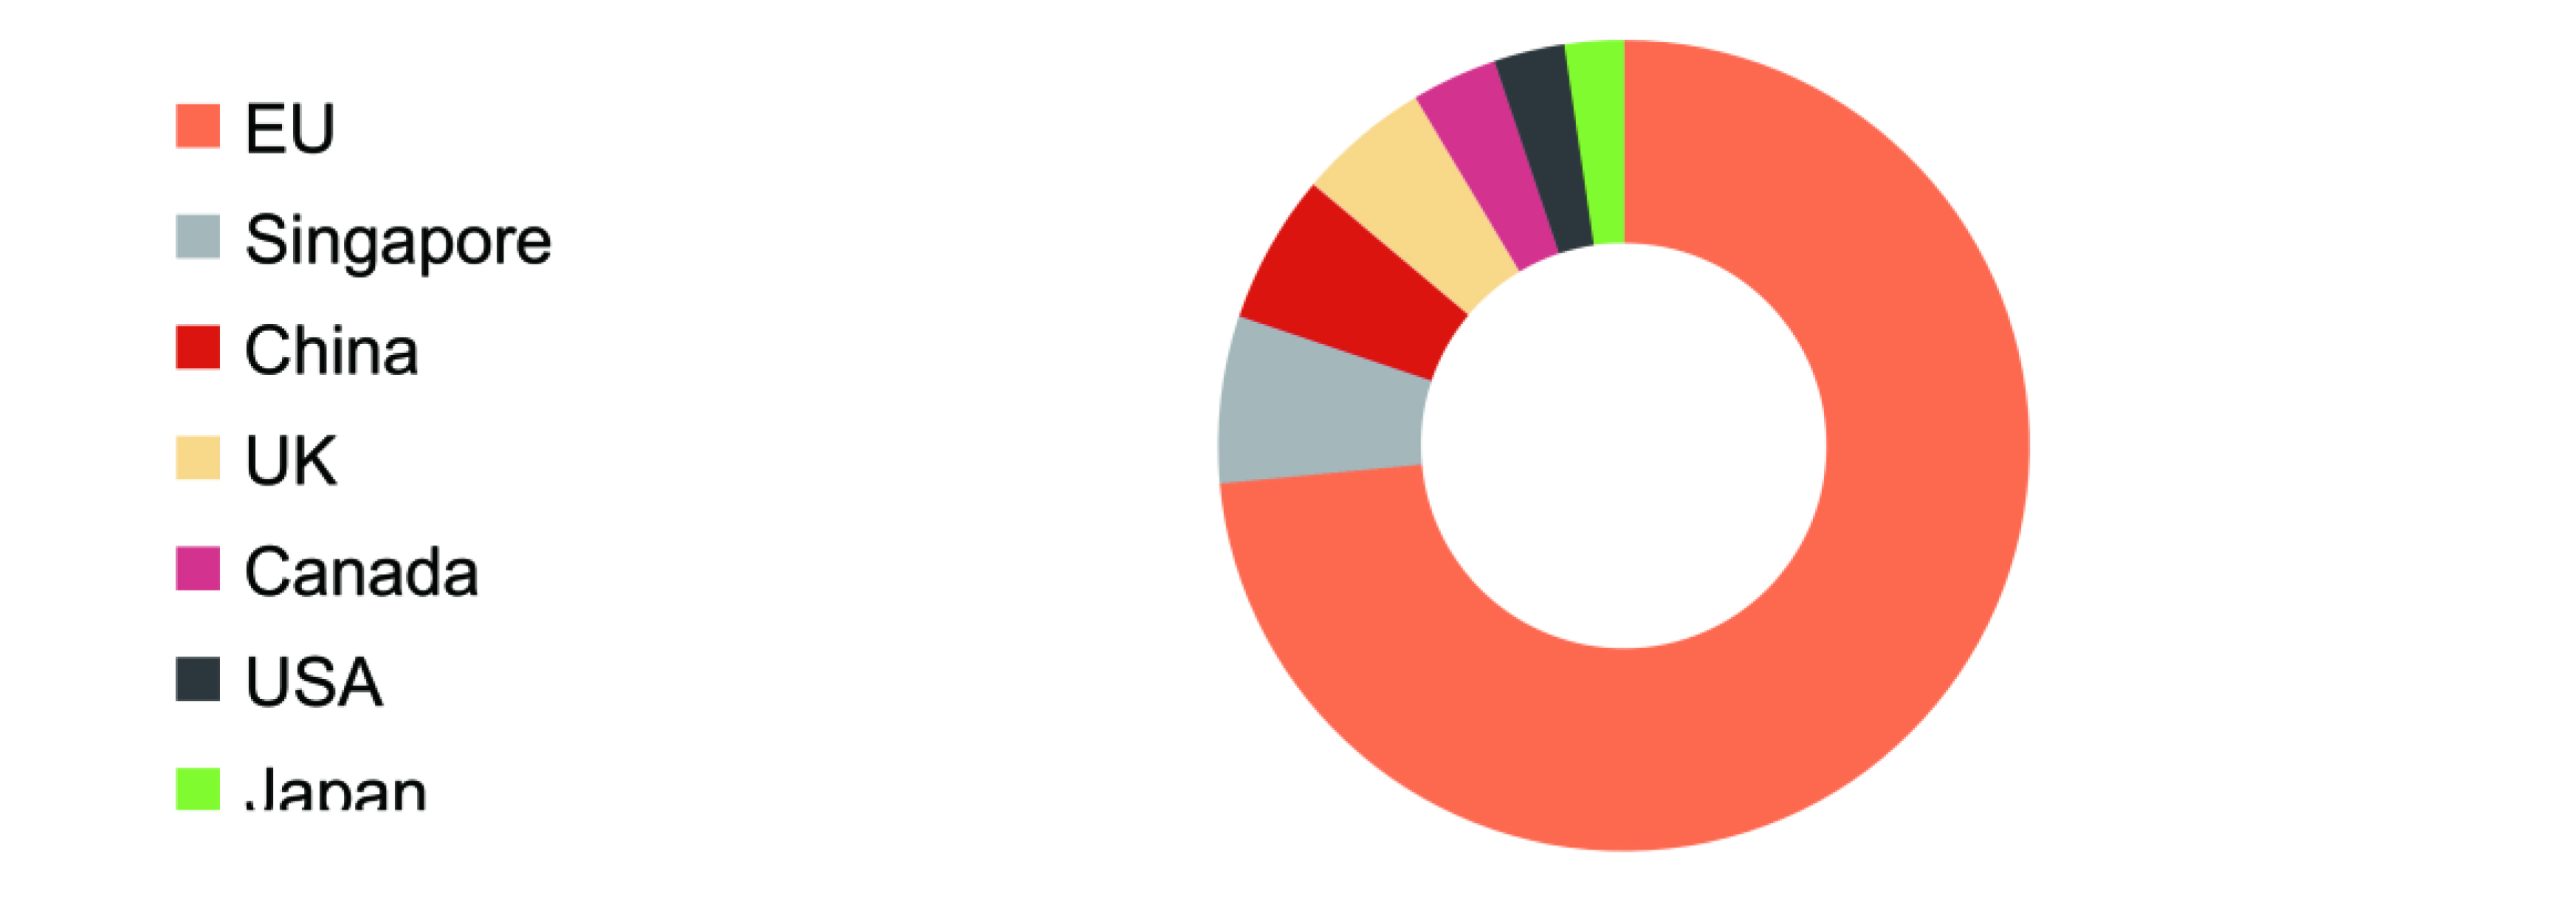
EU has been the biggest FDI investor followed by Singapore and China in the recent years. As at the first quarter of 2023, EU remains the biggest FDI investor with the total amount of 321.4 million USD.

FDI main source (USD millions, 2022)


Source: National Statistics Office

The annual growth rate of international investment short position was due to the following: The short position in other investment and foreign direct investments increased by 2,157 million USD and 219 million USD, respectively while the short position in portfolio investment and international reserves decreased by 1,115 million USD and 966 million USD, respectively.

Changes in IIP (Million USD)

Indicators 2020 2021 2022 Change

Amt

(22’21)

%

Foreign direct investment

-23,510

-25,457 -27,614 -2,157 8%

Portfolio investment

-4,301 -4,143 -2,992 1,151 -28%
Financial derivatives 4 11 0 -11

-100%

Other investment

-14,037 -14,510 -14,729 -219 2%
International reserves 4,526 4,366 3,400 -966

-22%

Total position 37,318 -39,733 -41,936 2,203

6%

Source: Bank of Mongolia

At the end of 2022, FDI stocks in Mongolia by investor countries are tentatively reported as follows: 40% from the Netherlands, 18% from China, from Singapore, 5% from Hong Kong, 5% from Japan and 3% from Luxembourg. FDI stock classified by economic activities reported as below; 71% of total FDI is invested in Mining and quarrying, 8% in the wholesale and retail trade, 5% in financial and activities, 3% in other service activities and 3 % in construction sector. Mongolia’s foreign portfolio investment assets recorded 505 million USD, and foreign liabilities were recorded at 3,498 million USD.

Foreign Trade 

As result of total turnover of foreign trade for the first 10 months 2023 amounted 20033.6 mln.USD indicating an increase in 2898.6 mln.USD or 16.9 percent against the same period of the last year.

The export volume exceeds the import volume by USD 4914.4 million and foreign trade balance turns to remains positive.

Foreign trade turnover (million USD) 

Category  2020  2021  2022 

2023 Oct

Export

7,576 9,247 12,540 12,473
Import 5,298 6,848 8,704

7,559

Turnover

12,875 16,095 21,244 20,033
Balance of trade 2,278 2,399 3,836

4,914


Export:

As result of foreign trade for the first 10 months 2023, the volume of export is 12474.0 mln.USD which means increase by 24.3 percent if compared with the same period of the last year.

Source: Customs General Administration

In total export minerals amounted 10719.0 mln.USD or 85.9%; export of natural or cultured pearls, precious or semi-precious stones 659.9 mln USD or 5.3%; export of textiles and textile articles 408.3 mln.USD or 3.3% and in total 94.5% of export came to these goods.


Import:

Mongolia has imported goods originating from 157 different countries including the China (40.3%), Russian Federation (25.7%), Japan (7.8%), Republic of Korea (4.5%), the USA (3.2%) and goods from these countries are equal to 81.5% of total import bewteen January and October in 2023.

Source: Customs General Administration

From January to October, 2023, in total import machinery, mechanic equipment and parts thereof, electric appliances, parts thereof amounted with value of 1459.9 mln.USD (19.3%), minerals-1713.9 mln.USD (22.7%) and among them (oil products were 1486.6 mln.USD 86.7%),  products of animal or vegetable origin and foodstuff 823.8 mln.USD (31.0%), vehicles and aircraft, parts thereof-1374.2 mln.USD (18.2%), base metals and products thereof –735.6 mln.USD (9.7%), chemical products – 414.2 mln.USD (5.5%)  and 82.7% of the total import comes to these goods and products.